

Published 26 June 2026. Analysis by the lookinto.co.uk Research team. Free to cite with attribution.
A typical 4kW solar system costs about £7,000 installed and pays for itself in roughly 10 to 11 years for the average UK home. We modelled real generation, electricity prices and export rates to show how payback changes across the country, from about 9 years on the south coast to nearly 13 in northern Scotland.
Six things our analysis found
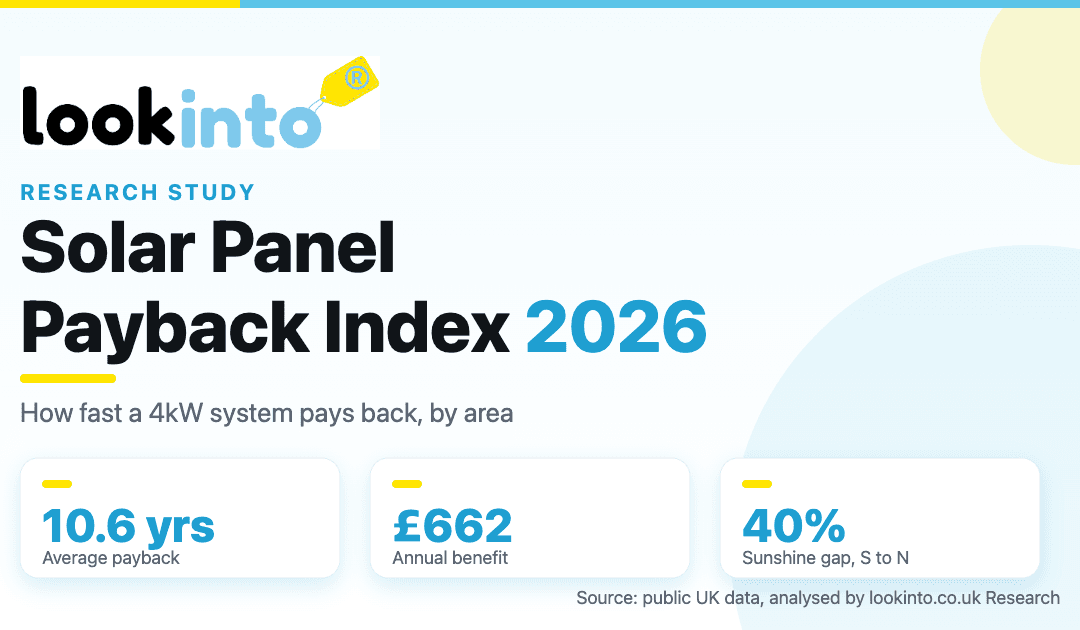
- A 4kW system pays for itself in about 10 to 11 years. At a £7,000 installed cost the average UK home recovers the outlay in 10.6 years, then earns for the rest of the panels’ 25-year working life.
- Where you live moves payback by more than three years. The same system pays back in 9.1 years on the south coast against 12.7 years in northern Scotland.
- UK sunshine varies by about 40%. Yields run from roughly 1,050 kWh per kilowatt on the south coast to 750 in northern Scotland, so two identical systems can generate very different amounts.
- The lifetime return is around £9,500. After paying back, a national-average system returns roughly £9,500 over 25 years on these assumptions, on top of the energy it saves.
- Using your own power beats exporting it. Electricity you use yourself saves about 24.67p per unit, while exported power earns 4 to 15p under the Smart Export Guarantee, so higher self-use shortens payback.
- Solar carries 0% VAT until 2027. The zero rate on home solar in Great Britain runs to 31 March 2027 and is worth around £1,400 on a £7,000 system.
Payback by area
We indexed each area’s generation against the UK average, which we set at 100. Sunnier southern areas generate more from the same panels, so they save more each year and pay back sooner.
| Area | Yield (kWh/kW) | Annual benefit | Payback | Index |
|---|---|---|---|---|
| South coast / Cornwall | 1,050 | £772 | 9.1 yrs | 117 |
| Devon | 1,020 | £750 | 9.3 yrs | 113 |
| Dorset | 1,010 | £743 | 9.4 yrs | 112 |
| UK average | 900 | £662 | 10.6 yrs | 100 |
| Yorkshire | 880 | £647 | 10.8 yrs | 98 |
| Lancashire | 860 | £632 | 11.1 yrs | 96 |
| Cumbria | 830 | £610 | 11.5 yrs | 92 |
| Northern Scotland | 750 | £552 | 12.7 yrs | 83 |
Annual benefit by area (4kW system)
How to shorten the payback
Self-consumption is the biggest lever. The more of your own generation you use rather than export, the more each unit is worth, because you avoid buying it at the full retail rate. Running heavy appliances during daylight, adding a hot-water diverter, or charging an electric car at home all help. A battery raises self-use further but adds several thousand pounds, which usually lengthens payback rather than shortening it. Choosing a competitive Smart Export Guarantee tariff also matters, as rates range from about 4p to 15p per unit.
Cite this study
This research is free to reproduce for editorial and educational use, with a credit and link to lookinto.co.uk. Suggested citation:
lookinto.co.uk Research (2026), The UK Solar Panel Payback Index 2026. https://lookinto.co.uk/energy/solar-panels/solar-panel-payback-index/Journalists and researchers: figures may be quoted directly. Contact us through the site for the underlying model.
Methodology and sources
The payback figures come from a transparent model applied consistently across every area. We did not survey installers. The inputs are:
- System: a 4 kWp installation costing £7,000 with 0% VAT, the midpoint of typical 2026 prices.
- Generation: regional yield (kWh per kW) times 4, using MCS and Energy Saving Trust irradiance data.
- Value of generation: 35% used in the home and saved at the Ofgem Q2 2026 price cap of 24.67p per unit, plus 65% exported at 15p under the Smart Export Guarantee (Octopus Outgoing). Blended value 18.4p per unit.
- Payback: system cost divided by annual benefit. Lifetime return: annual benefit over 25 years minus the system cost.
- 0% VAT on home solar in Great Britain: HM Treasury, in force until 31 March 2027.
Real results vary with roof orientation, shading, household usage, electricity prices and the export tariff chosen. This page is general information, not financial advice. Last updated 26 June 2026.
Frequently asked questions
- How long do solar panels take to pay for themselves in the UK?
- About 10 to 11 years for an average 4kW system costing £7,000. It is quicker in sunnier southern areas, around 9 years, and slower in the far north, closer to 13 years.
- How much do solar panels save a year?
- On our model an average 4kW system delivers about £662 a year in bill savings and export income combined, rising to roughly £772 on the south coast.
- Does location really make a difference?
- Yes. UK solar yields vary by about 40%, from roughly 1,050 kWh per kilowatt on the south coast to 750 in northern Scotland, which changes both annual savings and payback time.
- Is there still 0% VAT on solar panels?
- Yes. Home solar installations in Great Britain carry 0% VAT until 31 March 2027, worth around £1,400 on a £7,000 system.
- Is a battery worth it for faster payback?
- A battery increases how much of your own power you use, but it adds several thousand pounds and usually lengthens payback rather than shortening it.
Sources: Energy Saving Trust; MCS generation data; Ofgem price cap; Smart Export Guarantee tariffs.